

In today's world, data is constantly being collected and studied, whether we know it or not.
Everything from the pins you place on Google Maps, to last ‘like’ you gave on Facebook or the shared document you've just made an edit in - there is no shortage of data and opportunities to structure data into useful, contextual information.
The same goes for managing the heaps of data collected during regulatory activities, but what are you doing with that data? Leveraging this consistent flow of available information is critical in achieving effective decision-making and operational success within your regulatory team.
Metrics are defined as numbers that provide you with information about a certain process under question. Based on these numbers, you can analyze how this process is functioning and how it can provide you with a basis for improvement. The more you break down the process, the more refined your data becomes, and consequently, the more granular you can get with your collected metrics.
In today's tech-driven world, data is everywhere and is collected whether we know it or not (we’re looking at you, Cambridge Analytica). Data is a critical piece to the puzzle, helping you complete and justify changes to your strategy. Collecting data and analyzing your metrics allows you to validate your decisions, improve your submissions process and regulatory compliance strategy, and speed up your time to market.
Separating the regulatory submissions process into two distinct steps
With the help of John Fedirka, Senior Director of Regulatory Operations at Ironwood Pharmaceuticals, we've broken down submission preparation into two distinct steps. Each step, as John points out should be taken as two separate processes with separate timing data for each. Often these timelines are ineffectively lumped together, causing problems when the submission contents differ dramatically.
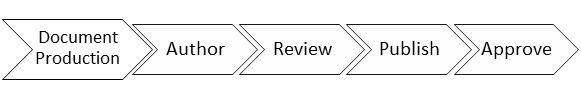
Step 1
The first step is document production, which includes authoring, reviewing, regulatory publishing, and approval of the document. This document creation step is the meat of the regulatory process, a task all regulatory operations (Reg Ops) teams are familiar with. During this process, there is data collected - and providing metrics on this, as John adamantly points out, is significant.
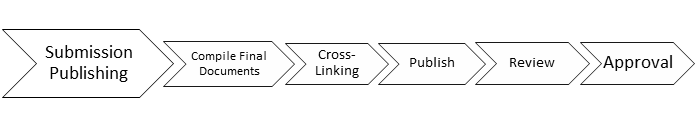
Step 2
The second step encompasses submission publishing, which involves pulling together multiple final documents, cross-linking, publishing, review and approval of the compiled submission.
Many organizations will choose to combine these two timelines, but John recommends separating the timelines and gather data independently. Combining these timelines can pose problems as John illustrates here of two different regulatory submissions to the FDA:
A standard metric for production of a new/updated investigator submission might be ‘4 days’. However, one investigator submission may consist of 4 CVs, 4 Form 1572s, a cover letter, and a Form 1571. Another investigator submission may include 300 CVs, 300 Form 1572s, a cover letter, and a Form 1571. Obviously, the time to publish 10 documents in the first example will be much shorter than the time to publish 602 documents in the second example.
The more you breakdown the process, the more granular and accurate your data becomes, and consequently the more metrics you have at your disposal. Although, as John points out, a lack of known details can be an issue when separating these timelines.
Let’s take a look at the metrics that can be measured within each of these two distinct steps.
Metric 1: Timeliness
A question often asked in Reg Ops is… how long will it take to prepare a submission?
It’s quite a loaded question. You may have even chuckled to yourself at the thought of having one direct answer, and with good reason! “The answer to that question for a new compound with a complex toxicology profile is vastly different than for preparing, for example, an IND for a new indication relying heavily on cross-referencing,” John remarks.
There is a considerable amount of time invested in mastering tasks such as importing documents and developing complete processes and workflows. Different submissions require different timelines, and to get even more granular, different content types require different methodologies. For this reason, analyzing your metrics can become a much more complex process than was once believed.
It is important to consider these factors when evaluating metrics. That is why John suggests looking at metrics on a document level and measuring the average time to publish documents based on the document type (e.g. new protocols, protocol amendments, a Nonclinical Tabular Summary).
For these metrics, John says that a primary concern is the average time from the point of ‘content lock’; when the content is final, and the document is handed off or publishing, through to the time the last approval is captured. The interest in this time range is based on the process used, especially for a Reg Ops team handling all the document publishing. In other organizations, typically the larger ones, publishing of many non-regulatory documents (e.g. toxicity reports and CSRs) might not be factored into a ‘submission’ timeline unless they happen to fall on a critical path.
For a broader picture, a motivated Program Management (PM) group may be interested in the total time for authoring and reviewing a document – in addition to publishing and approval. Frequently, a PM group may only be interested in those complete timelines for Regulatory-owned submission documents (e.g., Module 2 Summaries, Draft Labeling) and perhaps for those non-Regulatory critical path items (e.g., pivotal phase 3 CSR, a CMC Stability Report, etc.).
The main takeaway here is that investigating metrics on a document level and measuring the average time it takes to move through the authoring, reviewing, and ‘content lock’ rounds is the best method to evaluate timeliness. Yet, a final submissions document is no good if it’s rushed through the motions and prone to errors, which leads us into our second metric, quality.
Metric 2: Quality
How do you demonstrate and measure the quality of your submissions with multiple stakeholders involved?
Let’s cut to the chase: metrics around document quality is difficult to capture, but not impossible. And there still isn’t a straightforward, comprehensive and objective mechanism for automating quality check activities and capturing this kind of data. Despite having more structured submission formats, quality checks are still performed by humans and can be susceptible to errors sliding through the cracks. Manual processes like this tend to increase the risk of discrepancies or errors, yet documents managed electronically produce 58% fewer errors.
The use of a risk-based approach allows us to focus on high-risk areas to improve quality and align processes with the quality expectations of GxP regulated industries like the life sciences. When we asked John his take on this, he recommends taking a proactive approach. Keeping track of the quality of the documents from your external stakeholders is a metric that could give you a lot of insight on the status of your process and help to mitigate the risk of submissions failing to get approval.
To begin, knowing if an author or vendor often provides you with quality documentation can give your organization insight on a particular source’s process. Finding an objective mechanism to capture that data would allow you to compare, on a document-type basis, how much longer it takes to publish and approve documents from a certain source. This can justify decisions that were made for external vendors and authors by demonstrating the ‘downstream’ timeline benefits.
John also notes that for internal stakeholders, quality metrics can help set reasonable timelines for document publishing and can provide you with the numbers you need to adjust expectations if necessary. For that reason, continuous monitoring of quality metrics is crucial when trying to maintain submission health and to potentially address any significant issues with management.
Metric 3: Completeness
How can a Reg Ops team measure metrics around completeness?
At any point in time, it is important to know how complete your regulatory submission is at all levels. Completeness can be calculated based on the documents that are “final” approved against those that are expected in the submission, and not yet final. Having everyone know the status of your submission allows for better oversight. The ability to filter documents based on their completeness state gives oversight into where those documents are in the approval process, and what might be lagging. If you’re a Montrium customer, this process is painless in our RegDocs Connect module.
One study has shown that documents managed electronically are completed 23% faster than on paper. Successful research & development in the life sciences is heavily dependent on the accuracy and completeness of results in order to comply with regulatory requirements. And so, having the right reporting tool in place is crucial to study success.
A regulatory electronic document management system extended with regulatory information management functionality provides visual indicators that make measuring the completeness of your submissions more transparent. These regulatory submissions software solutions are typically developed and maintained according to an industry model for electronic regulatory submissions, so you can better measure completeness for all your document types in real-time.
Key takeaways
To summarize, gathering data is crucial in today’s world and what you do with that data can provide you with the information you need to tweak and perfect your regulatory processes. Data allows you to pinpoint bottlenecks, find what works well for your organization, and take the appropriate actions.
The three important metrics outlined here are timeliness, quality and completeness. Regardless of what metric you are looking at, it is important to break down your process and analyze all aspects of it. To keep up with a changing regulatory landscape and an increase in operational complexity, teams like Ironwood Pharmaceuticals are actively monitoring their metrics and adapting their processes to prepare submission-ready documents and records.
Whether you’re working from a paper-based or legacy document management system, regulatory submissions management software can help your process flow by significantly reducing the time required to push complete and compliant submission-ready content through its lifecycle.